Preface for (Un)Fortunately, The Market Doesn’t Care
As [researched and] told by Nthanda Manduwi
In 2026, I was selected as one of eight fellows for the inaugural Detroit Tech Residency Fellowship. It was not my first encounter with the city. I had visited twice before—once to help Alvaro move back after his internship, and again to attend Xbox Detroit Game Camp. Both visits were brief. My next was to be different. It required commitment. Twelve months, fully embedded.
As a programme builder myself, I appreciate the careful thought that went into the details of this residency. The fellowship is structured with intention. A one-year residency, supported by a monthly stipend applicable toward housing and living expenses, alongside access to Detroit’s core innovation infrastructure—TechTown, Bamboo, and Newlab at Michigan Central. It was designed as an incentive: to place builders inside the system.
When I applied, I really had no expectations. I apply for A LOT of things. The program was funded through a $210,000 Make MI Home grant awarded in May 2025 by the Michigan Growth Office, and administered by the Detroit Economic Growth Corporation (DEGC). It targeted early-stage, venture-backable founders who had graduated from Michigan institutions and were willing to relocate to Detroit for a continuous 12-month period. The premise was straightforward: proximity as a lever for economic participation.
Fellows are intended to inserted into an ecosystem. Workspace, networks, and institutional backing were structured to increase the probability of venture formation and survival within Detroit’s evolving innovation landscape.
“The City of Detroit is committed to keeping young innovators in Detroit and attracting new talent,” said Mayor Mike Duggan. “Michigan already produces top-level startup talent, and we want founders to know that they have a home in Detroit.”
That statement, on its surface, reads as a standard policy position. But beneath it sits a more interesting question—one that we will attempt to confront directly:
What does it mean to rebuild a system the market has already moved past? I realized I was stepping into a history lesson of capitalism: the possibilities, and the warnings.

Delve into Business and International Development with Nthanda Manduwi
Systems Don’t Have to Be Broken to Produce Bad Outcomes
I contemplated not publishing an episode this week [I explain why in the podcast], and then ended up recording my longest episode yet.
And to make up for publishing a little late the past two weeks, I am publishing this a day early. You’re welcome, or I am sorry?
I woke up to a message from a friend sharing a video of President William Ruto demanding Veto power for African nations at the 80th United Nations General Assembly [I happened to be in attendance], and I jumped out of bed and got to writing about my favorite beverage: tea! I also got to pen about slave trade, and colonization, and war [I know, what does any of this have to do with Hibiscus tea??!]
This week’s episode explores one of the central ideas behind the third book in the Lessons Book series – Systemic Nonsense: what if many of the frustrations we experience in institutions are not accidents or failures, but predictable outcomes of how those systems were designed?
It often feels like bureaucracy feels so resistant to change, and that reforms often produce more process than progress. It also seems that good intentions so rarely translate into meaningful outcomes. If you’ve pondered on these thoughts before, then these conversations are for you.
This Week’s Book
📖 Systemic Nonsense [Book 3]
This week only, from 27–31 July, the Kindle edition of Systemic Nonsense is available free as part of its Founders Edition launch.
Systemic Nonsense explores several ideas on international development in much greater depth. It asks a simple question:
What if the system isn’t failing? What if it’s doing exactly what it was designed to do?
Whether you listen, read, or dive into the book, I hope it leaves you asking better questions about the systems we inherit—and the ones we choose to build next.
How to Read
To receive your free Kindle copy:
* Click the Amazon link below.
* Select the Kindle edition while the promotion is active.
* Add it to your Kindle library.
You do not need a Kindle device. The free Kindle app works on iPhone, Android, tablets, Macs, and PCs, allowing you to build your digital library wherever you read.
Helpful Links
📚 Read this week’s book for free [search on Amazon or in Kindle for the book that is free for the week, and feel free to purchase the others]:http://amazon.com/dp/B0FQNJ61SB
📰 Subscribe to The Lessons Conversation:
Africa paperback pre-orders:https://forms.office.com/r/RMRMKTNd1M
Enjoyed listening to the Lessons Conversation? This post is public so feel free to share it.
This is a public episode. If you would like to discuss this with other subscribers or get access to bonus episodes, visit podcast.lessonsconversation.com
![Book 3: Systemic Nonsense [lessonsbooks.com]](https://byntha.com/wp-content/uploads/2026/07/podcast-episode-image-5a3bbb435029c89d668c5fa2682893ef-768x768.jpg)
I am taking my first few months in Detroit slow, learning her soul.
Detroit is a useful contradiction because it was not a peripheral city trying to become relevant. It was relevant—technologically, industrially, and culturally—at a scale that reshaped the global imagination of production. And then it ceased to function as the kind of system it had been.
The 1950 census lists Detroit at 1,849,568 residents. [2] By the 2020 decennial census, the city’s population is 639,111. [3] A structural unwind.
The misleading part is that the city is still physically large. The Census Bureau profile reports Detroit’s land area at about 138.7 square miles. [4] Detroit is large enough to fit the combined land areas of San Francisco, Boston, and Manhattan within its borders—and it actually ranks 64th in the United States by land area.
Strategic planning work on the city’s footprint emphasizes an additional detail: Detroit’s municipal boundaries have effectively been fixed since the 1920s, leaving a large service geography even as the number of residents inside it collapsed. [5] A city can lose people faster than it can shrink obligations: roads, pipes, streetlights, policing, fire response, and administrative overhead do not decline linearly with population. [6]
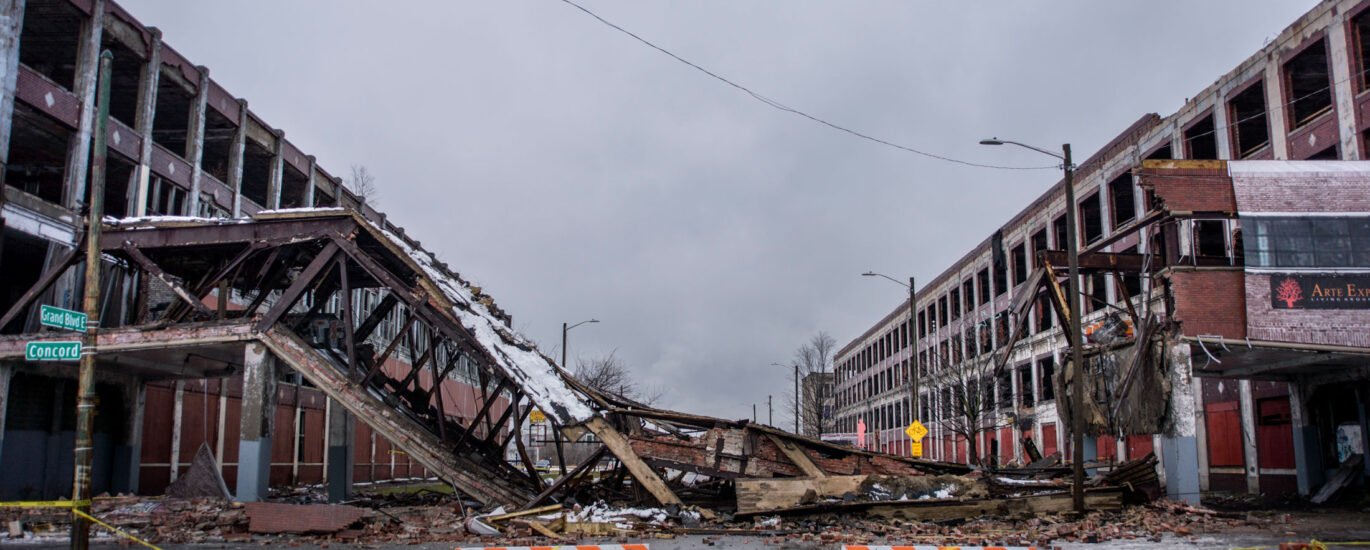
This is where the story usually becomes sentimental—images of ruins, blame, nostalgia, moral verdicts. I’m not interested in that. Detroit is not important because it is sad, dramatic, or uniquely “American.” It is important because it demonstrates a general rule about all economic systems: dominance is not a durable asset. It is a temporary equilibrium supported by conditions that can change. [7]
“Detroit did everything right—until it didn’t matter anymore.” That line is not a provocation; it is an economic framing. Systems don’t collapse only because they are poorly managed or corrupted (though those may matter). They collapse when the structure that once made them coherent stops producing value at market-clearing terms—when costs, demand, and relevance diverge. [8]
The point of this preface is to treat Detroit as evidence, not as lore: a case of relevance loss and institutional lag. The market did not “turn against” Detroit. It simply reallocated. [9]
Detroit ‘failed’ because it was strong in a narrow way—optimized for a world that stopped rewarding that optimization. [10]
The city’s productive logic was industrial concentration: an unusually dense clustering of manufacturing capacity, skills, and supplier networks anchored in autos. That kind of specialization can generate extraordinary productivity and wages through scale, standardization, and agglomeration. It also creates portfolio risk: when one industry is the tax base, the labor market, the identity story, and the political economy, a demand shock is not a sectoral issue. It becomes a system-level issue. [11]
The wage-consumption loop was explicit strategy. Ford Motor Company[12] is often cited for the 1914 decision to raise factory pay to “five dollars a day,” framed at the time as a business move to reduce turnover and improve productivity while enlarging the consumer base able to buy mass-produced goods. [13] Postwar labor arrangements reinforced that loop. The 1950 multi-year contract between United Auto Workers[14] and General Motors[15]—later nicknamed the “Treaty of Detroit”—codified wage and benefit improvements that helped stabilize household consumption, but also embedded long-horizon obligations into the industrial model. [16]
All of this is mechanical. High wages plus stable employment plus concentrated industry can create a locally self-reinforcing economy—until the assumptions underneath that loop stop holding. [17]
Once a city is specialized, it is not competing only on effort. It is competing on costs, technology, and demand. In autos, those terms shifted for decades.
Energy shocks and regulation altered consumer preferences and firm constraints. The U.S. government’s historical account of the 1973 oil embargo and its consequences emphasizes the broader economic disruption of energy price shocks, which translated into pressure for smaller, more fuel-efficient vehicles. The market share and sales data compiled by the Transportation Energy Data Book show a long-run shift in the U.S. car market in which “imports and transplants” became a majority share of car sales by the mid-2000s; for 2004, the report notes imports and transplants at 58.5% of car sales. [18] That statistic is not about patriotism or taste. It is about competitive substitution: consumers and fleets buying what best fits price-performance constraints, and capital moving toward production structures that meet those constraints. [19]
At the same time, manufacturing in the United States was undergoing broad employment decline and restructuring. Labor statistics analysis of long-run manufacturing employment documents a decades-long fall in manufacturing’s share of employment, with large losses occurring across multiple recessions and structural adjustments. [20] In other words, Detroit was not simply hit by “one bad decade.” It was exposed to a persistent national and global reweighting of what kinds of production, labor, and geography were rewarded. [21]
In Detroit specifically, the evidence for misalignment is visible in employment data. A synthesis of Detroit’s post-1950 trajectory by John McDonald reports that manufacturing employment among city residents fell from 201,000 in 1970 to 69,000 in 1990 (a drop of roughly two-thirds), alongside a broader decline in employed city residents. [22] That is what “relevance loss” looks like in labor-market terms: not the disappearance of work everywhere, but the evaporation of the form of work that made the city’s fiscal and social system coherent. [23]
When the economic base weakens, cities don’t collapse all at once. They enter feedback loops.
A credible municipal-finance mechanism is this: job loss and outmigration reduce property values and incomes; lower values and weaker household balance sheets reduce property tax collections; weak collections impair service delivery; degraded services further reduce willingness to pay and incentivize exit; borrowing becomes a bridge until it becomes a trap. [24]
Detroit’s property tax compliance problem is not a side note; it is a signal. A Lincoln Institute working paper estimates the property tax delinquency rate in Detroit at 48%, producing uncollected revenues of roughly 20%, and explicitly links delinquency to perceived inequity and failure to provide services—i.e., a breakdown in fiscal legitimacy. [25] I treat this as market information: residents and landlords behave like economic agents under uncertainty, making a (sometimes informal, sometimes explicit) assessment that payment is not worth the value received. [26]
The city’s large land footprint magnified the cost side of the equation. Detroit Future City’s “139 Square Miles” framing is not just branding; it points at a structural mismatch between service geography and a much smaller resident base. [27] Sparse or hollowed-out neighborhoods increase per-capita infrastructure burdens because fixed assets must still be maintained even when utilization drops. [28]
Federal infrastructure policy also matters here—not as politics, but as economics. Work published in HUD’s Cityscape summarizes research arguing that early interstate highway policy contributed to central-city population decline by combining regional accessibility benefits with local disamenities that reduced quality of life in neighborhoods near urban highways; it notes the 1956 Federal-Aid Highway Act’s authorization of an Interstate system to complete 41,000 miles by 1969. [29] Highways lowered suburban commuting costs while imposing neighborhood-level costs inside cities; that changes land values, household location choice, and the geography of job access. [30]
By 2013, Detroit’s fiscal reality converged with legal reality. A Michigan Bar Journal overview states that when Detroit filed for Chapter 9 bankruptcy on July 18, 2013, it was the largest Chapter 9 municipal bankruptcy in U.S. history; the bankruptcy petition cited more than $18 billion in debt and inability to provide basic services. [31] The same overview breaks down liabilities, including unsecured debt components such as unfunded pension obligations and other post-employment benefits. [31] Again: not moral, not symbolic, not narrative. A municipal balance sheet is an accounting expression of whether a city’s economic model still clears. [32]
When people say “the market,” they often mean something ideological. I mean something operational: the distributed system of buyers, workers, firms, lenders, insurers, and governments responding to constraints and signals. Markets do not need to be celebrated to be understood. They can be brutal and still be neutral in function.
A foundational economic idea is that prices and profits compress information about scarcity, demand, and substitution into signals that coordinate decisions across millions of actors. That is the core point of Friedrich Hayek’s “The Use of Knowledge in Society”: decentralized systems can process dispersed information through price changes, reallocating resources without any single planner needing the full picture. [33] The implication for a city is uncomfortable: no amount of local pride changes the opportunity set if the external payoff function changes. [34]
This is the thesis of this book, stated as plainly as possible.
The market does not care about:
It responds to:
Detroit is a clean example because it had history, identity, effort, and intention in abundance—and still experienced collapse once the underlying economics stopped working. [35]
When systems interpret market outcomes as moral judgments, they misread what is happening. Decline is rarely “punishment.” It is reallocation: of labor, of capital, of households, of firms, of tax base. The Cleveland Fed’s analysis of plant shutdown dynamics states the same concept at a local level: a plant shutdown can represent resource reallocation that may benefit the broader economy over time, while imposing painful adjustments on the locality that loses the jobs. [36] That is the market in practice: indifferent to local narratives, responsive to aggregate efficiency. [9]
For cities, the market’s “judgment” appears in proxies: vacancies, delinquency, bond ratings, insurance pricing, business formation, commuting patterns, and demographic movement. Detroit’s tax delinquency rate is not merely a civic issue; it is a price signal about legitimacy and service value. [25] The $18+ billion bankruptcy petition is not just legal drama; it is the point where deferred adjustments became unavoidable. [31]
A critical nuance: markets are not omniscient and they are not always efficient in any moral sense. Externalities, discrimination, and state policy shape the environment in which “market outcomes” occur. But even those forces typically express themselves through economic mechanisms—who can borrow, where firms invest, which neighborhoods get capital, and how quickly wealth can exit a jurisdiction. [37] The market does not care about fairness; it incorporates power through institutions. That is precisely why a neutral tone is required: neutrality is how systems actually operate. [38]
Detroit is not unique. It is simply legible.
What follows are six compact case studies—cities and firms—used as diagnostic models. In each: brief context, the economic change, ignored signals, why the model stopped clearing, and the transferable lesson.
Flint’s modern city system was built around auto employment density and the municipal finances that followed. One long-form fiscal case study notes that by 1978, over 80,000 Flint-area residents were employed by GM, followed by steep reductions by 1990 and the 2000s. [40]
What changed economically was not simply “lost jobs,” but the mismatch between an overbuilt city apparatus and a hollowed-out tax base. A 2022 University of Michigan fiscal-health report states the logic bluntly: Flint was built for 200,000 mostly middle-class auto workers; population loss and economic decline left a smaller and poorer population to “pay the bills,” making a city “over half empty” fiscally unsustainable without structural changes. [41]
The signals were visible: chronic deficits, escalating legacy costs, and erosion of service capacity. The 2011 MSU report describes severe chronic fiscal stress, revenue losses unlikely to be recovered, and labor-related expenditures at alarming levels, including negative pension cash flow and large OPEB liabilities. [40] Flint’s lesson is not advocacy; it is a municipal version of unit economics: a fixed-cost platform cannot survive when utilization collapses and revenue autonomy is limited. [42]
Transferable lesson: when a city is built for a scale of employment and income that no longer exists, “management” is insufficient. The model requires either new economic base formation or explicit downsizing of obligations—often both. [28]
Pittsburgh demonstrates a different variant: severe industrial shock followed by partial reconfiguration. The Cleveland Fed’s retrospective describes major structural adjustments to steel and manufacturing roughly 40 years ago and evaluates Pittsburgh’s subsequent performance across employment, population, and income measures. [44] It notes that Pittsburgh was hit hard in the early 1980s, but later experienced less severe job losses in the Great Recession and a faster return to pre-recession employment—evidence of a changed economic structure. [44]
What changed economically was sectoral composition: manufacturing ceased to be a specialization, while other industries (including healthcare and education) grew in employment share. [44] Brookings’ analysis of Pittsburgh’s resurgence similarly frames the shift as a move from advantages rooted in physical production to advantages rooted in skilled labor, research institutions, and technology-intensive clusters. [45]
Signals were not ignored so much as acted upon: institutional capacity (universities, philanthropic capital, civic strategy) appears in the literature as part of the reconfiguration engine. [46]
Transferable lesson: specialization is not fatal, but it increases the cost of transition. Cities that retain or build institutions capable of absorbing labor, attracting capital, and converting legacy assets into new production functions can reduce the duration of decline. [47]
Kodak is often presented as a parable about “innovation.” The economically correct framing is business-model collapse via demand substitution and delayed reconfiguration. U.S. EPA case documentation states that Kodak filed for bankruptcy on January 19, 2012. [49] Reuters’ reporting on the filing describes Kodak as a major corporate casualty of the digital transition, noting the failure to embrace modern technologies quickly enough and the plan to shrink significantly through restructuring. [50]
What changed economically was the profit logic. Film and processing were historically high-margin complements; digital imaging broke that complementarity and shifted value toward sensors, software, platforms, and later network distribution. [51] The key signal was not that Kodak lacked technical awareness—it had digital capabilities—but that its legacy revenue structure made the transition economically costly in the short run, generating internal incentives to delay cannibalization. [52]
The system stopped making sense when the installed base of consumer behavior and retail processing—Kodak’s economic moat—ceased to exist at scale. Bankruptcy was the balance-sheet recognition of a long demand shift. [53]
Transferable lesson: when an incumbent’s margins depend on complementarities that a new technology destroys, “innovation” is not the problem. Incentive alignment is. Firms collapse when they optimize for legacy rents as the market reprices the product category. [54]
As a geographic addendum, Kodak’s story is also the story of Rochester[55] as a company town exposed to a single enterprise’s relevance loss—showing again how overconcentration scales from firms into local economies. [53]
Nokia’s collapse in smartphones is a case of technological platform shift plus organizational lag. INSEAD’s strategy analysis summarizes Nokia’s trajectory from dominance in mobile phones to rapid decline, culminating in the sale of its devices business. [57]
What changed economically was the basis of competition: from hardware optimization and supply chain execution to software ecosystems, developer networks, and platform lock-in. When the market moved toward integrated smartphone platforms, Nokia’s existing competencies were devalued faster than its organization could retool. [58]
The signals were visible in ecosystem dynamics: consumer demand shifting toward app-based utility and user experience, and rivals consolidating developer attention. [59] The market outcome is documented in transaction form: Microsoft[60] announced on September 3, 2013 that it would purchase substantially all of Nokia’s Devices & Services business and license patents, with a stated total transaction price of EUR 5.44 billion (cash) and expected close in early 2014. [61] Nokia later announced completion of the sale in April 2014. [62]
Transferable lesson: when competition shifts from products to platforms, firms optimized for the old performance metrics can remain “excellent” while becoming irrelevant. Collapse is the lag between a changing payoff function and a slow internal governance system. [63]
Blockbuster illustrates how business-model substitution can kill a dominant retail network. The company’s own SEC filing states that on September 23, 2010, Blockbuster and certain subsidiaries filed voluntary petitions for relief under Chapter 11 in the Southern District of New York. [65] The SEC later noted the same filing date in a trading suspension notice tied to information deficiencies as the entity moved through bankruptcy administration. [66]
What changed economically was convenience, distribution, and consumer time cost. Physical retail stores carry high fixed costs and rely on foot traffic and inventory turn; digital distribution converts those costs into logistics, bandwidth, and data advantages. [67] When a competitor can deliver equivalent entertainment value with lower friction and more predictable pricing, the “winning” strategy is not better stores. It is a different cost structure. [65]
Ignoring signals often looks rational internally: a large store network is an asset until the moment it becomes a liability. The company’s bankruptcy narrative is essentially an accounting statement of that inversion. [65]
Transferable lesson: fixed assets that were once scale advantages can become drag the moment distribution technology changes. Being large does not protect you; it increases the switching cost of adaptation. [68]
The competitive displacement is simplest to state by naming the substitute: Netflix[69] represents the archetype of a lower-friction distribution model that converted consumer preferences for convenience into a scalable system. [70]
Bethlehem Steel is an industrial collapse case where cost structure and technological production form changed faster than legacy firms could adjust. A U.S. Nuclear Regulatory Commission notice lists Bethlehem Steel’s Chapter 11 case commencement date as October 15, 2001. [72]
What changed economically was not only global competition but the internal structure of steel production. The National Academy of Engineering’s overview of U.S. steel’s evolution highlights the rise of electric arc furnace production and other technological shifts that altered productivity and competitive dynamics. [73] Mini-mills using EAF technology could operate with different scale economics, labor structures, and input flexibility—reducing the cost disadvantage of smaller, more modular production relative to integrated mills. [74]
Bethlehem Steel also illustrates the weight of legacy obligations. A Congressional Research Service report focused on steel “legacy costs” describes large unfunded post-retirement health insurance obligations across major steel firms and treats these costs as a material component of competitiveness challenges. [75] In a market with falling or volatile margins, those embedded obligations behave like fixed costs that new entrants do not carry. [76]
Transferable lesson: in mature industries, collapse often looks like an accounting identity—new production technology plus new entrants reset the cost curve; incumbents with legacy obligations cannot price competitively without restructuring. Bankruptcy is the mechanism through which the market forces a reset when voluntary adaptation fails. [77]
Why do systems miss the signals?
Because humans do not perceive markets directly. We perceive stories about ourselves: “We are an auto city,” “We are a steel town,” “We are Kodak,” “We are the global phone brand.” Those stories compress chaos into identity. They also delay adaptation when identity becomes more important than revenue logic. [78]
In firms, this shows up as organizational inertia: sunk costs, internal politics, performance metrics optimized for the previous regime, and fear of cannibalizing the thing that still pays salaries today. Empirical work on organizational inertia in technology adoption explicitly treats inertia as a barrier when adoption requires significant internal transformation—precisely the condition triggered by major technological shifts. [79] That is not a psychological flaw; it is how institutions stabilize themselves—until stabilization becomes fragility. [80]
In cities, narrative inertia is often called “planning,” “revitalization,” or “growth strategies,” but the mechanism is similar. A city whose fiscal structure depends on a particular economic base will interpret threats to that base as temporary. It will try to borrow against recovery. It will underinvest in maintenance because the budget is constrained. It will lose the trust required for tax compliance. The Lincoln Institute’s Detroit delinquency paper describes exactly this kind of breakdown: perceived tax inequity and poor service provision contributing to nonpayment and weakening the fiscal contract. [25]
Detroit also illustrates how narratives lag reality when capital markets move first. The Chicago Fed’s discussion of Detroit’s bankruptcy context notes that the city’s declining fiscal position was well known and that its debt had been rated below investment grade for years before the filing—meaning the market had already repriced Detroit risk well in advance of the legal event. [81] When financing costs rise, a city’s ability to “buy time” shrinks. The narrative may still be hopeful; the yield spread is not. [82]
I treat this as a timing rule:
By the time a system realizes the market has moved on, much of the adjustment has already occurred through private behavior—exit, disinvestment, substitution—and the remaining choices are higher-cost, lower-agency options like bankruptcy, liquidation, or forced restructuring. [83]
Detroit’s often-discussed housing discrimination history matters here—not as moral commentary, but as a mechanism for how capital access and neighborhood stability were conditioned. Research on Detroit’s redlining history and later urban renewal describes discriminatory housing finance and displacement processes that shaped which neighborhoods accumulated wealth and which did not, affecting long-run resilience to shocks. [84] When a city’s households are structurally prevented from building buffers, the municipal system becomes more vulnerable to downturns because fewer residents can absorb tax increases, service declines, or temporary unemployment without exiting. [85]
In other words: narrative inertia delays recognition; institutional constraints reduce maneuverability; and the market resolves the mismatch through reallocation anyway. [86]
After dismantling the illusion of permanence, the useful question is not “how do we avoid collapse?” Collapse is sometimes the rational unwind of an obsolete structure. The question is: what characteristics reduce the probability that a system becomes obsolete without recourse?
The market rewards four things with unusual consistency:
Adaptability: the ability to reconfigure without catastrophic cost. [87]
Efficiency: not as virtue, but as survival—whether your cost structure clears against substitutes. [88]
Relevance: whether the thing you produce is demanded in the form you produce it. [89]
Responsiveness to signals: whether you update your model early rather than interpreting signals as noise. [90]
Detroit lost relevance because the system was optimized for a particular industrial configuration that could not easily be reconfigured at city scale once global competition, technology, suburbanization, and fiscal erosion compounded. [91] Pittsburgh shows that partial recovery becomes more plausible when new industries can absorb labor and when institutional capacity supports transition. [47] Kodak, Nokia, Blockbuster, and Bethlehem Steel show the same rule at the firm level: once the market reprices your category, your past dominance does not buy you credit. It buys you legacy costs. [92]
For builders—especially infrastructure builders—this is not philosophy. It is design constraint.
First, avoid single-point dependence. Detroit’s overconcentration problem is the city-scale version of a startup betting its entire existence on one customer, one supplier, or one regulatory assumption. Diversify revenue streams, supplier options, and routes to market early—not because it is elegant, but because it reduces the cost of adaptation when the payoff function changes. [93]
Second, treat fixed costs as existential risk. City collapse is often a fixed-cost story: large geography, large legacy obligations, large debt servicing, and a shrinking denominator. [94] For firms, fixed costs are leases, payroll rigidity, and capital assets that cannot be repurposed. For infrastructure companies, fixed costs are even more serious because physical systems are harder to pivot than software. The response is not “stay small.” It is modularity: build systems that can scale down, re-route, or switch inputs without full rebuild. [95]
Third, design for substitution, not for loyalty. Markets do not care about your intention. They care whether a substitute becomes cheaper, faster, or more convenient. Blockbuster’s scale did not protect it from a distribution substitute. Nokia’s brand did not protect it from a platform substitute. [96] Assume your users will switch when something better appears; then build as if you must earn relevance repeatedly. [97]
Fourth, monitor signals that feel “beneath” the narrative. In cities, tax delinquency, vacancy, and bond ratings are signals. In firms, churn, margin compression, and channel shift are signals. In all cases, the earlier you treat them as real—and not as temporary betrayal—the less violent the eventual adjustment. [98]
A common mental model divides the world into “developed” systems that are stable and “developing” systems that are fragile. Detroit is evidence against that model. Stability is conditional. Rich systems can become obsolete; poor systems can become relevant. [99]
But Detroit also warns against the inverse fantasy: that building in places with visible slack automatically creates advantage. Slack is only potential energy if you can convert it into productive capacity and market access. [28]
If I compare Detroit to building in African cities, I do not do it as cultural argument. I do it as cost-structure and market-access comparison. On the African continent, multiple empirical sources emphasize that trade and transport frictions remain high. The World Bank’s work on transport prices and costs in Africa documents that transport prices are high relative to the value of goods transported, which directly penalizes manufacturing and time-sensitive logistics. [100] UN Trade and Development’s Africa-focused reporting highlights infrastructure gaps (transport, energy, ICT) as drivers of elevated trade costs relative to global benchmarks, reducing competitiveness. [101]
Market size is also fragmented in practice. UNCTAD’s published “Facts & Figures” notes that intra-African exports were 16.6% of total exports in 2017, compared with much higher intraregional shares in Europe and Asia—an indicator (imperfect but useful) of how much demand is still oriented outward rather than integrated across neighboring markets. [102] Manufacturing’s share of GDP in Sub-Saharan Africa has historically been modest and volatile relative to regions that industrialized earlier, as reflected in World Bank indicator series on manufacturing value added as a percent of GDP. [103]
This is not pessimism. It is accounting. High logistics costs, unreliable energy, and thinner intra-regional trade integration raise the threshold that a firm must clear before it becomes globally competitive—even if labor is cheap or demand is growing. [104]
Detroit, despite its collapse, sits inside a large, deeply liquid market with established legal and financial infrastructure, and a national logistics mesh that reduces many categories of transaction cost. The same interstate policy that helped hollow out central cities also created a continental distribution advantage once you can operate within it. [29] The question, then, is not “America versus Africa.” The question is: where are the binding constraints on your specific system easiest to relax?
If you are building cyber-physical infrastructure, the binding constraints are rarely just talent. They include supply chain reliability, parts availability, certification pathways, financing, insurance, and the ability to iterate hardware without multi-month import delays. Those are market-structure questions. [105]
Detroit becomes strategically interesting under this framing: not because it is broken, but because it is a place where the consequences of misaligned systems are visible, measurable, and close to the surface—while still being embedded in a large market that can reward relevance if you build it. [106]
The builder’s discipline is to separate what feels meaningful from what is economically true.
Do not build for validation. Do not build for identity coherence. Do not build to “prove” that a place can recover. Those are narratives. Markets do not price narratives unless narratives change demand. [107]
Build for systems that clear:
Detroit’s collapse is the penalty for mistaking past dominance for permanent relevance. The transferable rule is not “diversify.” It is sharper:
Build so that when the payoff function changes, you can change too—faster than the market exits you. [108]
Detroit is not a story about why cities “should” or “shouldn’t” do things. It is what happens when an economic base becomes overconcentrated, when cost structures harden, when institutions lag signals, and when the geography of value creation moves faster than the governance of the city can adjust. [91]
If that sounds like Detroit-specific pathology, the comparative cases argue otherwise. Kodak, Nokia, Blockbuster, and Bethlehem Steel are not Detroit; they are the same mechanism at different scales: relevance loss, delayed adaptation, balance-sheet recognition, and restructuring. [92] Flint shows the municipal version of the same arithmetic: a city built for one scale cannot survive indefinitely at another without structural change. [42] Pittsburgh shows that transition is possible, but it is not automatic and it is not costless. [47]
The final lesson:
The market does not care. And that is precisely why it must be understood. [86]
The Lessons book series, releases on July 6, 2026.
Each book expands on the themes introduced here—examining systems, history, and the human behaviors that continue to shape our world.
Pre-orders are now open at bienbooks.com, and your early support means more than you know as I bring this body of work to life.
If you’d like to go deeper into my journey — from Malawi, through the United Nations to Microsoft, you can find it in my books.
P.S. for 2026, you can read any of my books via Kindle for only $2.99.
This offer is valid till the end of the year.
Links to the books are as below:
[1] [57] [58] [59] [63] [69] [78]
INSEAD. (n.d.). Strategic decisions that caused Nokia’s failure.
https://knowledge.insead.edu/strategy/strategic-decisions-caused-nokias-failure
[2] [35]
U.S. Census Bureau. (1950). 1950 Census of population: Advance reports. Series PC-8.
https://www2.census.gov/library/publications/decennial/1950/pc-08/pc-8-21.pdf
[3]
U.S. Census Bureau. (n.d.). Detroit city, Michigan profile.
https://data.census.gov/profile/Detroit_city%2C_Michigan?g=160XX00US2622000
[4]
U.S. Census Bureau. (n.d.). Detroit city, Wayne County, Michigan profile.
https://data.census.gov/profile/Detroit_city%2C_Wayne_County%2C_Michigan?g=060XX00US2616322000
[5] [27] [94]
Detroit Future City. (2017). 139 square miles: Detroit future city strategic framework.
https://detroitfuturecity.com/wp-content/uploads/2017/11/DFC_139-SQ-Mile_Report.pdf
[6] [28] [41] [42] [55]
Center for Local, State, and Urban Policy (CLOSUP). (2022). Flint financial crisis report.
https://closup.umich.edu/sites/closup/files/2022-06/CLOSUP-Flint-Financial-FINAL-June2022.pdf
[7] [8] [10] [71]
ResearchGate. (n.d.). What happened to and in Detroit.
https://www.researchgate.net/publication/272246265_What_Happened_to_and_in_Detroit
[9] [15] [36] [39]
Federal Reserve Bank of Cleveland. (1980). Local labor-market response to a plant shutdown.
https://fraser.stlouisfed.org/files/docs/publications/frbclevreview/pages/1980-1984/68462_1980-1984.pdf
[11] [17] [22] [23] [43] [91] [93]
ResearchGate. (n.d.). Employment in Detroit (1000s).
https://www.researchgate.net/figure/Employment-in-Detroit-1000s_tbl3_272246265
[12] [29] [30]
U.S. Department of Housing and Urban Development. (2020). Cityscape: Two essays on unequal growth in housing.
https://www.huduser.gov/portal/periodicals/cityscpe/vol22num2/ch5.pdf
[13]
The Henry Ford. (n.d.). Ford’s five-dollar day.
https://www.thehenryford.org/collections/explore/articles/fords-five-dollar-day
[14] [33] [34] [56] [86] [97] [107]
Hayek, F. A. (1945). The use of knowledge in society.
https://statisticaleconomics.org/wp-content/uploads/2013/03/the_use_of_knowledge_in_society_-_hayek.pdf
[16]
MotorCities National Heritage Area. (n.d.). Reuther’s Treaty of Detroit.
https://motorcities.org/making-tracks/1950/reuther-s-treaty-of-detroit
[18] [19] [88]
Oak Ridge National Laboratory. (2006). Transportation energy data book (Edition 25).
https://tedb.ornl.gov/wp-content/uploads/2019/03/Edition25_Full_Doc.pdf
[20] [21]
U.S. Bureau of Labor Statistics. (n.d.). Forty years of falling manufacturing employment.
https://www.bls.gov/opub/btn/volume-9/forty-years-of-falling-manufacturing-employment.htm
[24] [25] [26] [98]
Lincoln Institute of Land Policy. (2014). Detroit property tax delinquency: Social contract in crisis.
https://www.lincolninst.edu/app/uploads/legacy-files/pubfiles/alm-wp14ja3.pdf
[31] [32] [83] [99] [106]
State Bar of Michigan. (n.d.). Detroit bankruptcy analysis.
https://www.michbar.org/file/barjournal/article/documents/pdf4article2698.pdf
[37] [38] [64] [84] [85]
National Institutes of Health. (n.d.). The legacy of redlining in Detroit.
https://pmc.ncbi.nlm.nih.gov/articles/PMC6345551/
[40]
City of Flint. (2011). Flint economic study.
https://www.cityofflint.com/wp-content/uploads/Reports/MSUE_FlintStudy2011.pdf
[44] [47]
Federal Reserve Bank of Cleveland. (n.d.). Industrial heartland: Pittsburgh report.
https://www.clevelandfed.org/-/media/project/clevelandfedtenant/clevelandfedsite/regional-analysis/industrial-heartland/report-pittsburgh.pdf
[45] [46]
Brookings Institution. (2017). Pittsburgh economic transformation report.
https://www.brookings.edu/wp-content/uploads/2017/09/pittsburgh_full.pdf
[48] [50] [51] [60] [89] [92]
Reuters. (2012). Photography pioneer Kodak files for bankruptcy.
https://www.reuters.com/article/business/photography-pioneer-kodak-files-for-bankruptcy-idUSTRE80I08H/
[49] [53]
U.S. Environmental Protection Agency. (n.d.). Bankruptcy settlements: Eastman Kodak Company.
https://www.epa.gov/enforcement/case-summary-bankruptcy-settlements-reached-eastman-kodak-company-worth-49-million
[52] [54]
Harvard Business Review. (2016). Kodak’s downfall wasn’t about technology.
https://hbr.org/2016/07/kodaks-downfall-wasnt-about-technology
[61]
Microsoft. (2013). Microsoft to acquire Nokia’s devices & services business.
https://news.microsoft.com/source/2013/09/03/microsoft-to-acquire-nokias-devices-services-business-license-nokias-patents-and-mapping-services/
[62]
Nokia. (2014). Nokia completes sale of devices & services business.
https://www.nokia.com/newsroom/nokia-completes-sale-of-substantially-all-of-its-devices–services-business-to-microsoft/
[65] [67] [68] [96]
Blockbuster Inc. (2011). Form 10-K. U.S. Securities and Exchange Commission.
https://www.sec.gov/Archives/edgar/data/1085734/000119312511186981/d10k.htm
[66]
U.S. Securities and Exchange Commission. (2011). Blockbuster liquidation notice.
https://www.sec.gov/news/press/2011/secinfo-bbliquidation.htm
[70]
Cato Institute. (n.d.). Lessons from the rise of Netflix and fall of Blockbuster.
https://www.cato.org/commentary/lessons-rise-netflix-fall-blockbuster
[72] [77]
U.S. Nuclear Regulatory Commission. (n.d.). Nuclear safety report.
https://www.nrc.gov/docs/ml0201/ML020160101.pdf
[73]
National Academy of Engineering. (n.d.). The rise of the U.S. steel industry.
https://www.nae.edu/313347/The-Rise-of-the-US-Steel-Industry
[74] [95]
Springer. (2008). Steel industry analysis.
https://link.springer.com/article/10.1007/s11663-008-9216-9
[75] [76]
Congressional Research Service. (n.d.). Steel industry report.
https://www.everycrsreport.com/reports/RL31279.html
[79] [80] [87] [108]
CORE. (n.d.). Industrial decline analysis.
https://core.ac.uk/download/pdf/301362029.pdf
[81] [82] [90]
Federal Reserve Bank of Chicago. (2014). Chicago Fed Letter.
https://www.chicagofed.org/publications/chicago-fed-letter/2014/january-318a
[100] [104] [105]
World Bank. (n.d.). Economic development report.
https://openknowledge.worldbank.org/entities/publication/c8547e25-86db-5b83-b06e-d413f28f4d66
[101]
UNCTAD. (2024). Economic development in Africa report 2024.
https://unctad.org/publication/economic-development-africa-report-2024
[102]
UNCTAD. (n.d.). Facts and figures.
https://unctad.org/press-material/facts-figures-0
[103]
World Bank. (n.d.). Manufacturing value added (% of GDP).
https://data.worldbank.org/indicator/NV.IND.MANF.ZS?locations=ZG

Nthanda Manduwi is a Malawian storyteller, entrepreneur, digital transformation advocate, and community builder driven by the mission to empower Africa’s economic landscape through innovation and technology.