
As [researched and] told by Nthanda Manduwi
The phrase “Africa is the next big opportunity” is usually built on a single observable: population growth. That is not wrong, but it is incomplete. Population is a supply-side fact; a market is a demand-side reality. The difference is mechanical, and it shows up in unit economics, cash conversion cycles, and capital allocation. [1]
In my thinking, I treat Africa not as a monolith, but as a set of markets that must clear three conditions before global-scale firms treat them as economically inevitable:
These conditions determine whether a region transitions from potential value to realized value. [2]
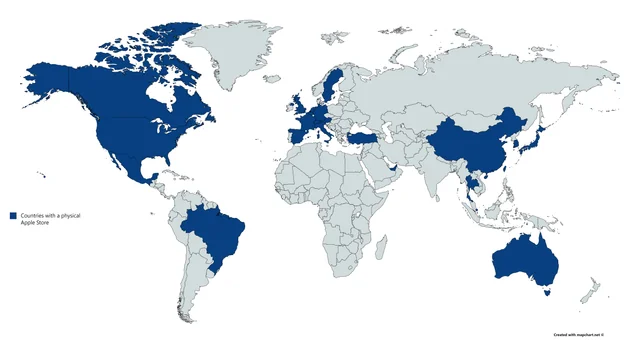
I was casually scrolling on Twitter [now X] on the 24th of March, 2026,, and I came across a tweet, expressing shock at the fact that there are no Apple Stores on the African continent.
Much of the discourse on Africa oscillates between narratives of exclusion and inclusion, often supported by selective indicators that emphasize future potential. As I write, I do not attempt to validate or dismiss those narratives. Instead, I want us to examine the logic of capital allocation—how firms decide where to build, where to wait, and where to operate through low-commitment structures. That logic is observable in data: in geographic segmentation, infrastructure investment, pricing strategies, and required return horizons. [3]
In the summer of 2025 I was working with Microsoft Xbox in Redmond as a Business Development Manager. During that summer, I found myself in a set of conversations that have now shaped how I think about markets.
The mission for me was simple: what would it take to expand Xbox meaningfully into Africa?
At the time, I was working under with the Developer Acceleration Program: onboarding game developers from underrepresented regions, including Africa. The work demonstrated that African studios could build, ship, and operate within a global platform.
At the same time, a different constraint became clear.
The limiting factor was, I was to find, market viability.
As I analyzed the data within the Developer Acceleration Program, a consistent pricing pattern emerged. Games targeting Europe or North America could sustain price points in the range of $15–$40 while achieving meaningful adoption. The same products, when positioned for smaller markets such as Malawi, required pricing closer to $1–$10 to generate volume.
This pricing delta reshapes the entire economic structure of the product:
The implication is straightforward: expansion decisions are constrained by the ability of the market to sustain the product’s economics.
Africa continues to be described as a “missing” region in global market expansion.
In practice, it appears in the analysis and does not meet the threshold conditions required for scale.
Global firms expand where:
Where these conditions are weak or inconsistent, expansion does not progress beyond exploratory initiatives.
From this perspective, Africa’s limited presence across global platforms reflects economic filtering rather than omission.
This distinction changes the strategic response. If the constraint is framed as exclusion, the response centers on access and inclusion mechanisms. If the constraint is economic, the response centers on building the underlying conditions that support market formation:
Under these conditions, participation emerges as a function of viability rather than intervention.
On our Thursday evening walks my mentor at Xbox, we approached the question of the expansion of Xbox to EMEA from first principles—through the lens of market economics. Our discussions consistently converged on a single framework: unit economics.
When Unit economics, at its simplest, asks whether the lifetime value of a customer (or transaction) exceeds the cost to acquire and serve that customer. When unit economics do not work, scaling compounds losses; when they do, scale industrializes profit. [4]
At a market level, this logic maps cleanly onto three levers:
A useful way to see revealed preference is corporate geographic reporting.
Apple[8] manages its business primarily by geography; its reportable segments are Americas, Europe, Greater China, Japan, and Rest of Asia Pacific—and its segment definition makes a material point: “Europe includes European countries, as well as India, the Middle East and Africa.” [9] That is not a cultural statement; it is an accounting and managerial statement about aggregation, materiality, and operating structure. [9]
For fiscal year 2024, Apple reported total net sales of $391.035B, with net sales by segment of $167.045B (Americas), $101.328B (Europe—explicitly including Africa), $66.952B (Greater China), $25.052B (Japan), and $30.658B (Rest of Asia Pacific). [10] In other words, Africa’s commercial reality—at least as it appears in one of the world’s most scaled consumer hardware/services companies—is subsumed inside a broader region, not because Africa is nonexistent, but because its standalone economic weight (for that firm, in that period) does not force separation. [11]
Apple’s filings also clarify how a firm can generate revenue across geographies without “full stack” local investment: it sells through a mixture of direct and indirect channels, including retail and online stores and third-party carriers, wholesalers, retailers, and resellers; in 2024, 38% of net sales were through direct channels and 62% through indirect channels. [12] This matters because it illustrates a general pattern: when markets do not yet justify fixed-cost commitment, firms prefer variable-cost distribution architectures. [13]
The claim that “Africa is left out” becomes analytically precise when translated into unit economics: where do revenues exist today, at what margin, at what volatility, and at what cost-to-serve—and what would have to change for fixed-cost investment to dominate variable-cost opportunism? [2]
The demographic dividend in economic theory is not simply “a lot of young people.” It is a time-bounded growth acceleration that can occur when fertility declines rapidly, the dependency ratio falls, and the working-age share rises—if the economy can productively absorb that labor through investments and reforms. [14]
The World Bank[15] frames the first dividend as requiring, at minimum: (a) catalyzing the demographic transition (notably fertility decline), (b) increasing investments in health and education, and (c) implementing macro-fiscal and labor reforms so the “bulge cohort” can find well-paying jobs rather than being trapped in unemployment or low-productivity work. [16] This is why the demographic dividend is best understood as demographic transition + economic transition, not demographics alone. [16]
Africa’s age structure is shifting in ways that keep the “window” plausibly open. A UNECA analysis (drawing on UN population projections) states that Africa’s working-age population (20–64) is projected to rise from 883 million in 2024 to 1.6 billion in 2050, approaching one-quarter of global working-age population. [17] The International Monetary Fund[18] similarly emphasizes that Africa will remain the largest source of global population growth for decades and that its working-age population will grow faster than any other age group. [19]
But the Africa test is not whether working-age numbers rise; it is whether labor can be converted into output at scale. Two pressure points explain why the dividend can become a mirage.
First, employment absorption: in Sub-Saharan Africa[20], modeled estimates show sectoral employment shares around 2025 of ~48% agriculture, ~12% industry, and ~38% services. [21] In a context where nearly half of employment remains in agriculture and industry remains a small employer, the mechanisms that historically absorbed large cohorts—urban wage employment, scalable tradable services, and manufacturing-driven productivity catch-up—are structurally constrained. [22]
Second, informality and low-productivity equilibrium: the International Labour Organization[23] estimates that 87.3% of the employed population in sub-Saharan Africa was in informal employment in 2022 (about 373 million people). [24] High informality is not merely a “jobs quality” issue; it is a market formation issue. Informal work typically implies weaker contractual enforcement, thinner tax capacity, more volatile incomes, and reduced consumer finance penetration—all of which compress effective demand and raise cost-to-serve for formal platform businesses. [25]
This does not mean the dividend is impossible, but rather that the dividend is conditional, and the binding constraints are not demographic; they are institutional and productive. [26]
A population becomes a market when a sufficient share of households can reliably pay for non-subsistence goods and services. The challenge is not that demand is absent; it is that demand is often thinly monetizable at price points that support global cost structures. [27]
The World Bank’s 2024 poverty synthesis notes that sub-Saharan Africa contains about two-thirds of the world’s extreme poor while accounting for roughly one-sixth of global population. [28] Even allowing for the important methodological update to global poverty lines in 2025 (the international poverty line moving from $2.15 to $3.00 per person per day due to a PPP update), the underlying point remains stable: a large share of the population cluster is concentrated below thresholds that support discretionary spending at scale. [29]
On income levels, the World Bank reports 2024 GDP per capita (PPP, current international $) around $5,517 for sub-Saharan Africa versus about $23,248 for East Asia & Pacific (excluding high income) and about $52,463 for Europe & Central Asia. [30] Those differences matter because they map into expected ARPU ceilings, device affordability, and the feasibility of financing consumer durables. [31]
A second way to express the same constraint is consumption scale. World Bank expenditure data puts sub-Saharan Africa’s final consumption expenditure (current US$) at roughly $2.0 trillion in 2024. [32] In absolute terms, that is large; in comparative terms, it is the consumption base of a set of markets that are geographically wide, institutionally heterogeneous, and logistically costly to serve. [33]
This is also where “middle class” narratives often fail. Definitions vary widely—from $2–$20/day classifications used in some policy debates to higher thresholds aligned with discretionary capacity—and results swing dramatically based on the definition. [34] The African Development Bank[35] has historically used broad bands (e.g., $2–$20/day) to describe an African “middle class,” explicitly noting the sensitivity of estimates to thresholds. [36] Meanwhile, contemporary poverty datasets (World Bank PIP, as presented by Our World in Data) show how large the share of population remains below higher daily-consumption cutoffs (e.g., $10/day), underscoring why “population as TAM” routinely overstates monetizable demand. [37]
The practical conclusion is not “Africa is poor.” The practical conclusion is: market formation is lumpy. Monetizable demand concentrates in specific corridors, cities, and segments; and most pan-African strategies fail when they average away this distributional reality. [7]
When investors say “infrastructure,” they usually mean roads, power, and connectivity. In unit economics terms, infrastructure is something more precise: it is the difference between variable cost and fixed cost, between predictable service delivery and persistent exception-handling, between scalable distribution and manual workarounds. [6]
Digital infrastructure is improving, but the gap between coverage and use remains decisive. In the GSMA[38]’s Mobile Economy Sub-Saharan Africa report, mobile internet penetration reached 27% by end-2023, while the “usage gap” remained about 60%—meaning many people are covered by broadband-capable networks but not using mobile internet, often due to affordability and skills constraints. [39] The same report notes that nearly 44% of the population subscribed to a mobile service by end-2023 (527 million subscribers). [39] These numbers imply that “access” (coverage) is no longer the only constraint; monetizable connectivity (devices + data + literacy + relevant services) is the binding layer. [40]
Energy is a harder constraint because it directly taxes productivity. The International Energy Agency[41] estimates that almost 600 million people in Africa still lack access to electricity and that reaching universal access requires scaling investment/financing to about $15 billion per year. [42] At a firm level, unreliable power shows up as forced capex (generators, fuel logistics, redundant systems) and as downtime; World Bank Enterprise Survey data indicate that 73% of firms in sub-Saharan Africa experienced electrical outages in 2024 (versus 29% in high-income economies). [43] This is not a social statistic—it is a cost function. [44]
Logistics is the third leg of cost-to-serve. Trade cost literature emphasizes that “trade costs” include far more than tariffs: transport, border delays, distribution margins, and institutional frictions can act like large ad valorem taxes on commerce. [45] The 2024 UNCTAD[46] Economic Development in Africa overview describes African transport costs as among the highest globally, citing underdeveloped road networks and logistical inefficiencies; it notes that landlocked countries can face transport costs up to 50% higher than coastal countries and that intra-African transport costs are particularly high relative to extra-African transport costs. [47] In the World Bank’s Logistics Performance Index data, the 2022 overall LPI score for sub-Saharan Africa is 2.53 (on a 1–5 scale), below the world score of 3.02. [48]
These infrastructure and logistics constraints do not simply “slow development.” They systematically raise cost-to-serve, which then requires either higher prices (incompatible with income distribution) or lower margins (incompatible with global hurdle rates). That is how a region becomes “out of the conversation” without anyone needing to be “anti” anything. [49]
A market capable of sustaining high fixed-cost infrastructure needs demand density: enough paying customers per square kilometer to amortize retail leases, last-mile networks, service centers, returns logistics, and customer support. [50]
Africa’s urbanization is creating density, but unevenly. An OECD[51] report on Africa’s urbanisation dynamics projects Africa’s urban population reaching about 1.4 billion by 2050, and emphasizes that a large share of urban growth will be concentrated in big cities and large agglomerations. [52] Urbanization, in principle, reduces transaction costs and can improve service delivery economies of scale—but only when urban growth is matched by infrastructure and institutional capacity. [7]
Yet density is counteracted by fragmentation. The macro version of fragmentation is widely documented: trade within Africa remains structurally low relative to other regions, with intra-African trade around 16% of total trade, even as regional agreements aim to raise integration. [53] The World Bank’s AfCFTA work emphasizes that deeper integration can raise incomes and reduce poverty, but it also highlights that benefits depend on implementation—tariff reductions alone are not enough without trade facilitation, transport improvements, and coordinated regulation. [54]
The micro version of fragmentation is what platform builders experience: multiple jurisdictions, overlapping regulatory regimes, currency risk, language localization, and uneven enforcement. Those are not “soft” issues; they are direct costs, and they undermine the scale economics that justify fixed-cost investment. [2]
This is why the “single Apple Store” debate can be intellectually misleading. The relevant question is not symbolic presence; it is whether demand density and standardization justify a retail-and-service footprint compared to indirect distribution. When a firm can capture revenue through resellers and carriers (variable-cost channels), its default is to delay fixed-cost commitments until the market clears. [55]
Demographic dividends have occurred before, most famously across high-performing East Asian economies. The World Bank’s demographic dividend framing explicitly links the concept’s origins to the interaction between age-structure shifts and fast growth in East Asia. [16] The “East Asian Miracle” analysis emphasizes a combination of high investment, rapid productivity gains, and extraordinarily fast growth in manufactured exports—alongside faster fertility decline than other developing regions during the high-growth period. [56]
The transferable lesson is not “copy East Asia.” The transferable lesson is that the demographic dividend was monetized through structural transformation—moving labor into higher-productivity sectors and into forms of work that scale through firms, supply chains, and export markets. [57]
Africa’s present industrial structure explains why the comparison is difficult. UNIDO[58] reports that in 2024 Africa accounted for 3.2% of global GDP but only 2.0% of global manufacturing value added, and about 1.4% of global manufactured-goods exports—indicating limited integration into scaled manufacturing and tradables relative to demographic weight. [59] It also notes that manufacturing employment has grown since 2015 while labor productivity declined because output growth did not keep pace with labor increases, pointing to an expansion that is not yet productivity-led. [59]
This matters because demographic pressure without productivity absorption produces three outcomes that investors recognize immediately: (1) an expanding low-income consumer base with limited ARPU, (2) elevated political and fiscal stress, and (3) persistent currency and inflation volatility that raises risk-adjusted discount rates. [60]
The only historically consistent way to convert a youth bulge into durable market formation is to raise labor productivity—through energy reliability, logistics, human capital, and industrial clustering—so that incomes rise and unit economics shift. That is not an ideological position; it is a structural identity. [61]
If “opportunity” means investable pathways to scale, then Africa’s opportunities are best described as systems that improve unit economics, not as slogans about demographics.
The first opportunity zone is reliable power as a productivity multiplier. The IEA’s estimate of ~$15B/year financing needs to reach universal electricity access is not just a development figure; it is a market-creation figure because power reliability reduces downtime, lowers operating costs, and enables modern cold chains, manufacturing, and digital services. [62] The investable question is less “generation capacity” in isolation and more “bankable delivery models”—grid densification where demand density exists, and decentralized solutions where it does not. [63]
The second opportunity zone is trade logistics and corridor economics. UNCTAD’s point that landlocked countries can face transport costs up to 50% higher than coastal countries makes the business case: lowering logistics friction directly expands feasible price bands, improves inventory turns, and reduces the “hidden tax” embedded in consumer prices. [2] Regional integration via African Continental Free Trade Area[64] can compound these gains by expanding the addressable market beyond national borders, but only if trade facilitation and physical corridors are funded and executed. [65]
The third opportunity zone is payments and identity rails that convert access into monetization. The World Bank’s Global Findex data show that mobile money is already a distinctive feature of African financial infrastructure; in sub-Saharan Africa, 33% of adults reported having a mobile money account (2021). [66] This is a real asset for platform business models—because it reduces one of the classic frictions in emerging markets: the inability to collect small payments cheaply and reliably. [67] The constraint is that payments rails do not automatically create purchasing power; they mainly lower the cost of transaction and expand the feasible set of business models once income exists. [68]
The fourth opportunity zone is agricultural productivity and agro-processing, where the unit economics are not about consumer ARPU but about raising incomes at the source. Sub-Saharan Africa’s cereal yields remain far below global averages (e.g., roughly ~1.6–1.7 tons/ha versus ~4.2 tons/ha globally in recent data), implying that large productivity upside exists if inputs, extension, irrigation, and logistics constraints are addressed. [69] Low input intensity is part of the picture: World Bank fertilizer consumption data show sub-Saharan Africa (excluding high income) at about 16.7 kg per hectare of arable land in 2022, far below agronomically intensive systems. [70] The opportunity is not “agritech” as an app category; it is income creation through yield and value-chain efficiency, which then enlarges the monetizable consumer base downstream. [71]
The fifth opportunity zone is mobile-first consumer platforms where installed base exists—with the key caveat that installed base is still constrained by affordability. GSMA data show both momentum and limits: mobile internet penetration at 27% (end-2023) and a large usage gap. [39] In entertainment, one sees this shape clearly: the African gaming market’s growth is widely reported as being led by mobile, not consoles, because mobile maps onto the existing device base and payment behavior. [72] The implication for any platform strategy (including gaming) is simple: design for the device and payment rails that exist, not for the ecosystems you wish existed. [73]
Across all these zones, the “real opportunity” is not just that Africa has a young population. The real opportunity is that specific investments can shift the parameters of unit economics—raising productivity and incomes while lowering cost-to-serve—until fixed-cost commitment becomes rational for scaled firms. [61]
Africa is not “deliberately left out” of global markets as a matter of narrative; it is often priced out of global-unit-economics as a matter of structure. That structure is visible in income distribution and poverty concentration, in infrastructure gaps that raise cost-to-serve, in logistics and regulatory fragmentation that prevent scale efficiencies, and in labor markets where informality dominates and productivity growth is insufficient to absorb a rapidly expanding workforce. [74]
The demographic dividend is therefore best treated as a conditional forecast, not a guarantee. The working-age surge can become output growth only if the economy can create productive jobs, raise human capital, and build the energy, logistics, and institutional rails that allow firms to scale—and to compete, not merely to “enter.” [26]
In practical terms, Africa becomes economically undeniable when three numbers move together: (1) productivity rises (in farms, firms, and cities), (2) cost-to-serve falls (power reliability, logistics, payments, and regulation), and (3) demand density increases (urban clusters integrated into larger markets). When that happens, corporate geography stops bundling Africa into other segments—not because anyone changed their mind, but because the numbers forced the change. [75]
The Lessons book series, releases on July 6, 2026.
Each book expands on the themes introduced here—examining systems, history, and the human behaviors that continue to shape our world.
Pre-orders are now open at bienbooks.com, and your early support means more than you know as I bring this body of work to life.
If you’d like to go deeper into my journey — from Malawi, through the United Nations to Microsoft, you can find it in my books.
P.S. for 2026, you can read any of my books via Kindle for only $2.99.
This offer is valid till the end of the year.
Links to the books are as below:
[1] [19]
International Monetary Fund. (2023). Africa’s century? Finance & Development. https://www.imf.org/en/publications/fandd/issues/2023/09/pt-african-century
[2] [18] [20] [23] [47] [49] [71]
United Nations Conference on Trade and Development. (2024). Economic development in Africa report 2024: Overview. https://unctad.org/system/files/official-document/aldcafrica2024-overview_en.pdf
[3] [6] [45]
Rodrik, D., Subramanian, A., & Trebbi, F. (2004). Institutions rule: The primacy of institutions over geography and integration in economic development. Journal of Economic Literature, 42(3), 691–751. https://ideas.repec.org/a/aea/jeclit/v42y2004i3p691-751.html
[4]
Mercury. (n.d.). Understanding unit economics. https://mercury.com/blog/understanding-unit-economics
[5] [27] [30] [31]
World Bank. (n.d.). GDP per capita, PPP (current international $). https://data.worldbank.org/indicator/NY.GDP.PCAP.PP.CD
[7] [50] [51] [52]
Organisation for Economic Co-operation and Development. (2025). Africa’s urbanisation dynamics 2025. https://www.oecd.org/content/dam/oecd/en/publications/reports/2025/03/africa-s-urbanisation-dynamics-2025_005a8aa0/2a47845c-en.pdf
[8] [15] [39] [40] [73]
GSMA. (2024). The mobile economy Sub-Saharan Africa 2024. https://event-assets.gsma.com/pdf/GSMA_ME_SSA_2024_Web.pdf
[9] [11] [12] [13] [55] [75]
Apple Inc. (2024). Form 10-K for the fiscal year ended September 28, 2024. U.S. Securities and Exchange Commission. https://www.sec.gov/Archives/edgar/data/320193/000032019324000123/aapl-20240928.htm
[10] [35]
Apple Inc. (2024). FY24 Q4 consolidated financial statements. https://www.apple.com/newsroom/pdfs/fy2024-q4/FY24_Q4_Consolidated_Financial_Statements.pdf
[14] [16] [26] [46]
World Bank. (2019). Demographic dividend: Operational tool for pre-dividend countries. https://documents1.worldbank.org/curated/en/781891550815372274/pdf/Demographic-Dividend-Operational-Tool-for-Pre-Dividend-Countries.pdf
[17] [58]
United Nations Economic Commission for Africa. (n.d.). As Africa’s population crosses 1.5 billion, the demographic window is opening. https://www.uneca.org/stories/%28blog%29-as-africa%E2%80%99s-population-crosses-1.5-billion%2C-the-demographic-window-is-opening-getting
[21]
World Bank. (n.d.). Employment in agriculture (% of total employment). https://databank.worldbank.org/data/reports.aspx?country=COD%2CSSA&series=SL.AGR.EMPL.ZS&source=2
[22]
World Bank. (n.d.). Employment in industry (% of total employment). https://data.worldbank.org/indicator/SL.IND.EMPL.ZS
[24] [25] [60]
International Labour Organization. (2023). World employment and social outlook: Trends 2023.
[28]
World Bank. (2024). Poverty, prosperity, and planet 2024. https://thedocs.worldbank.org/en/doc/8a15c9610fbd102de8f0a293199edcd9-0360012024/original/Poverty-Prosperity-and-Planet-2024-jp-120424.pdf
[29]
World Bank. (2025). June 2025 update to global poverty lines. https://www.worldbank.org/en/news/factsheet/2025/06/05/june-2025-update-to-global-poverty-lines
[32] [33] [41]
World Bank. (n.d.). Final consumption expenditure (current US$). https://data.worldbank.org/indicator/NE.CON.TOTL.CD
[34]
Hugon, P. (2012). Africa in the global economy. Afrique contemporaine, 17–32. https://shs.cairn.info/journal-afrique-contemporaine1-2012-4-page-17?lang=en
[36]
International Monetary Fund. (n.d.). World economic outlook database. https://www.imf.org/external/datamapper/datasets/WEO
[37]
Our World in Data. (n.d.). Share living with less than $10 per day. https://ourworldindata.org/grapher/share-living-with-less-than-10-int–per-day
[38] [54] [65]
World Bank. (2020). Poverty and shared prosperity. https://openknowledge.worldbank.org/server/api/core/bitstreams/43714eab-d8ca-5d65-a1b9-f749a3c010ee/content
[42] [61] [62] [63]
International Energy Agency. (2023). Financing electricity access in Africa. https://www.iea.org/reports/financing-electricity-access-in-africa
[43] [44] [64]
World Bank. (n.d.). Firms experiencing electrical outages (% of firms). https://data.worldbank.org/indicator/IC.ELC.OUTG.ZS
[48]
World Bank. (n.d.). Logistics performance index. https://data.worldbank.org/indicator/LP.LPI.OVRL.XQ
[53]
GSMA Intelligence. (2023). Accelerating smartphone adoption in Africa. https://www.gsmaintelligence.com/research/accelerating-smartphone-adoption-in-africa
[56] [57]
World Bank. (2017). Global financial development report. https://documents1.worldbank.org/curated/en/322361469672160172/pdf/123510v20PUB0r00Box371943B00PUBLIC0.pdf
[59]
United Nations Industrial Development Organization. (2025). Industrial statistics factsheet: Africa. https://stat.unido.org/portal/storage/file/publications/yb/2025/UNIDO_IndustrialStatistics_Factsheet_Africa_2025.pdf
[66] [67] [68]
CGAP. (2021). Findex 2021 insights: Boosting financial inclusion in Africa. https://www.cgap.org/blog/findex-2021-insights-boosting-financial-inclusion-in-africa
[69]
World Bank. (n.d.). Cereal yield (kg per hectare). https://data.worldbank.org/indicator/AG.YLD.CREL.KG
[70]
World Bank. (n.d.). Fertilizer consumption (% of arable land). https://data.worldbank.org/indicator/AG.CON.FERT.ZS
[72]
PwC. (2023). Entertainment and media outlook. https://www.pwc.com/ke/en/publications/entertainment-and-media-outlook.html
[74]
Our World in Data. (n.d.). Extreme poverty distribution in Sub-Saharan Africa. https://ourworldindata.org/data-insights/one-in-six-people-live-in-sub-saharan-africa-but-it-accounts-for-two-thirds-of-global-extreme-poverty


Nthanda Manduwi is a Malawian storyteller, entrepreneur, digital transformation advocate, and community builder driven by the mission to empower Africa’s economic landscape through innovation and technology.